PROBLEM
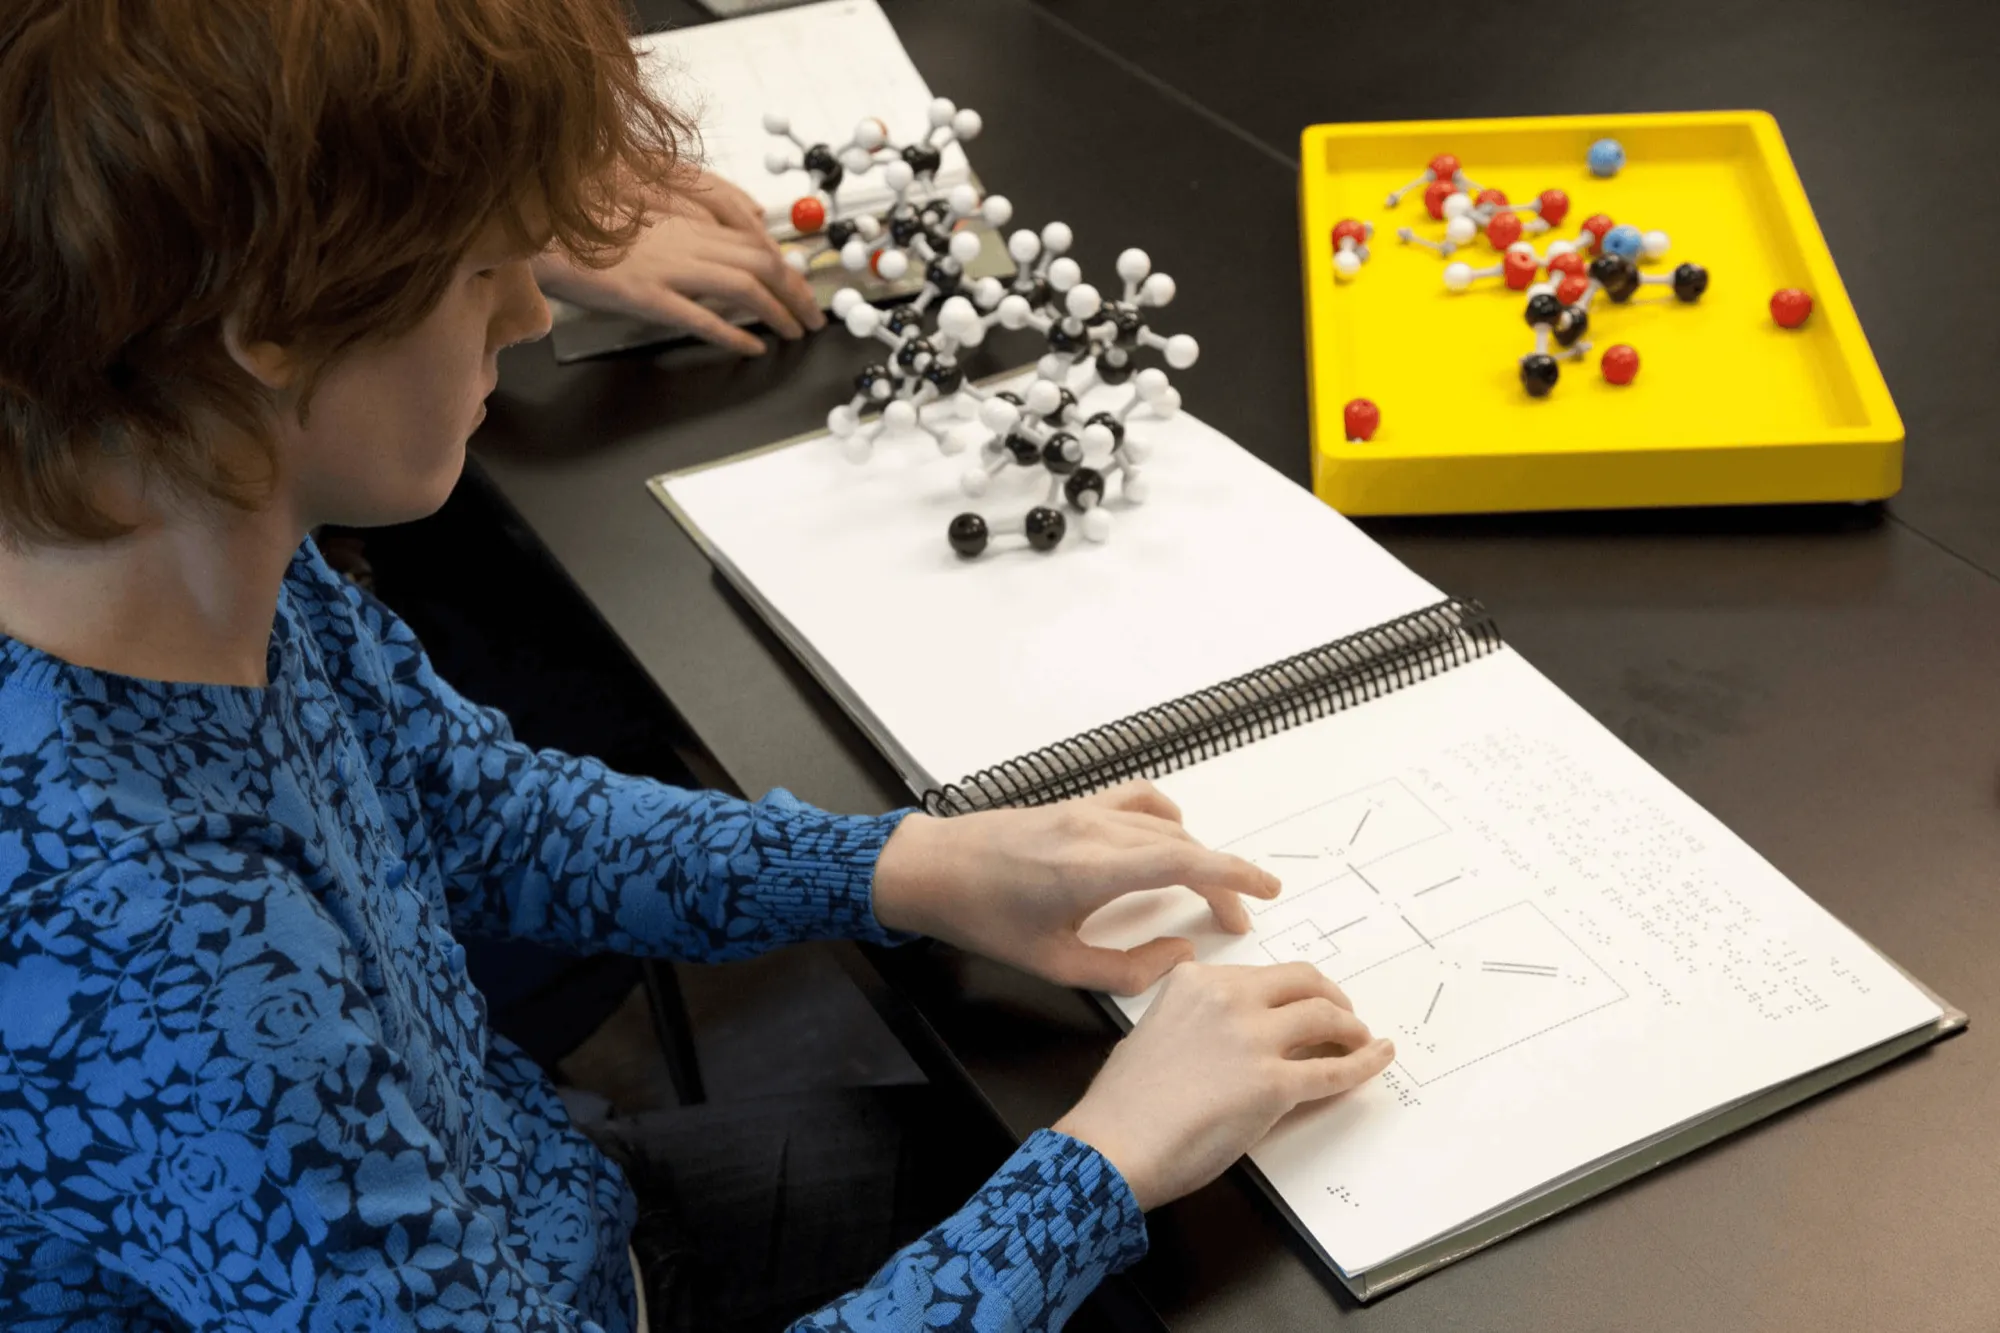
Visually impaired students cannot take in graphic information visually, so they learn from the tactile graphics in braille textbooks or from separate tactile teaching aids. In today’s classrooms, those materials are in short supply.
Tactile graphics in braille textbooks are hard to produce and to maintain, and they rarely cover every graphic in the original textbook, so students often get only a portion. Tactile aids are usually made by teachers themselves, which takes time and money, and durability problems make them hard to keep in use.
These constraints limit what visually impaired students have the chance to learn, and they put a load on teachers. Another way of making tactile materials is needed.
APPROACH
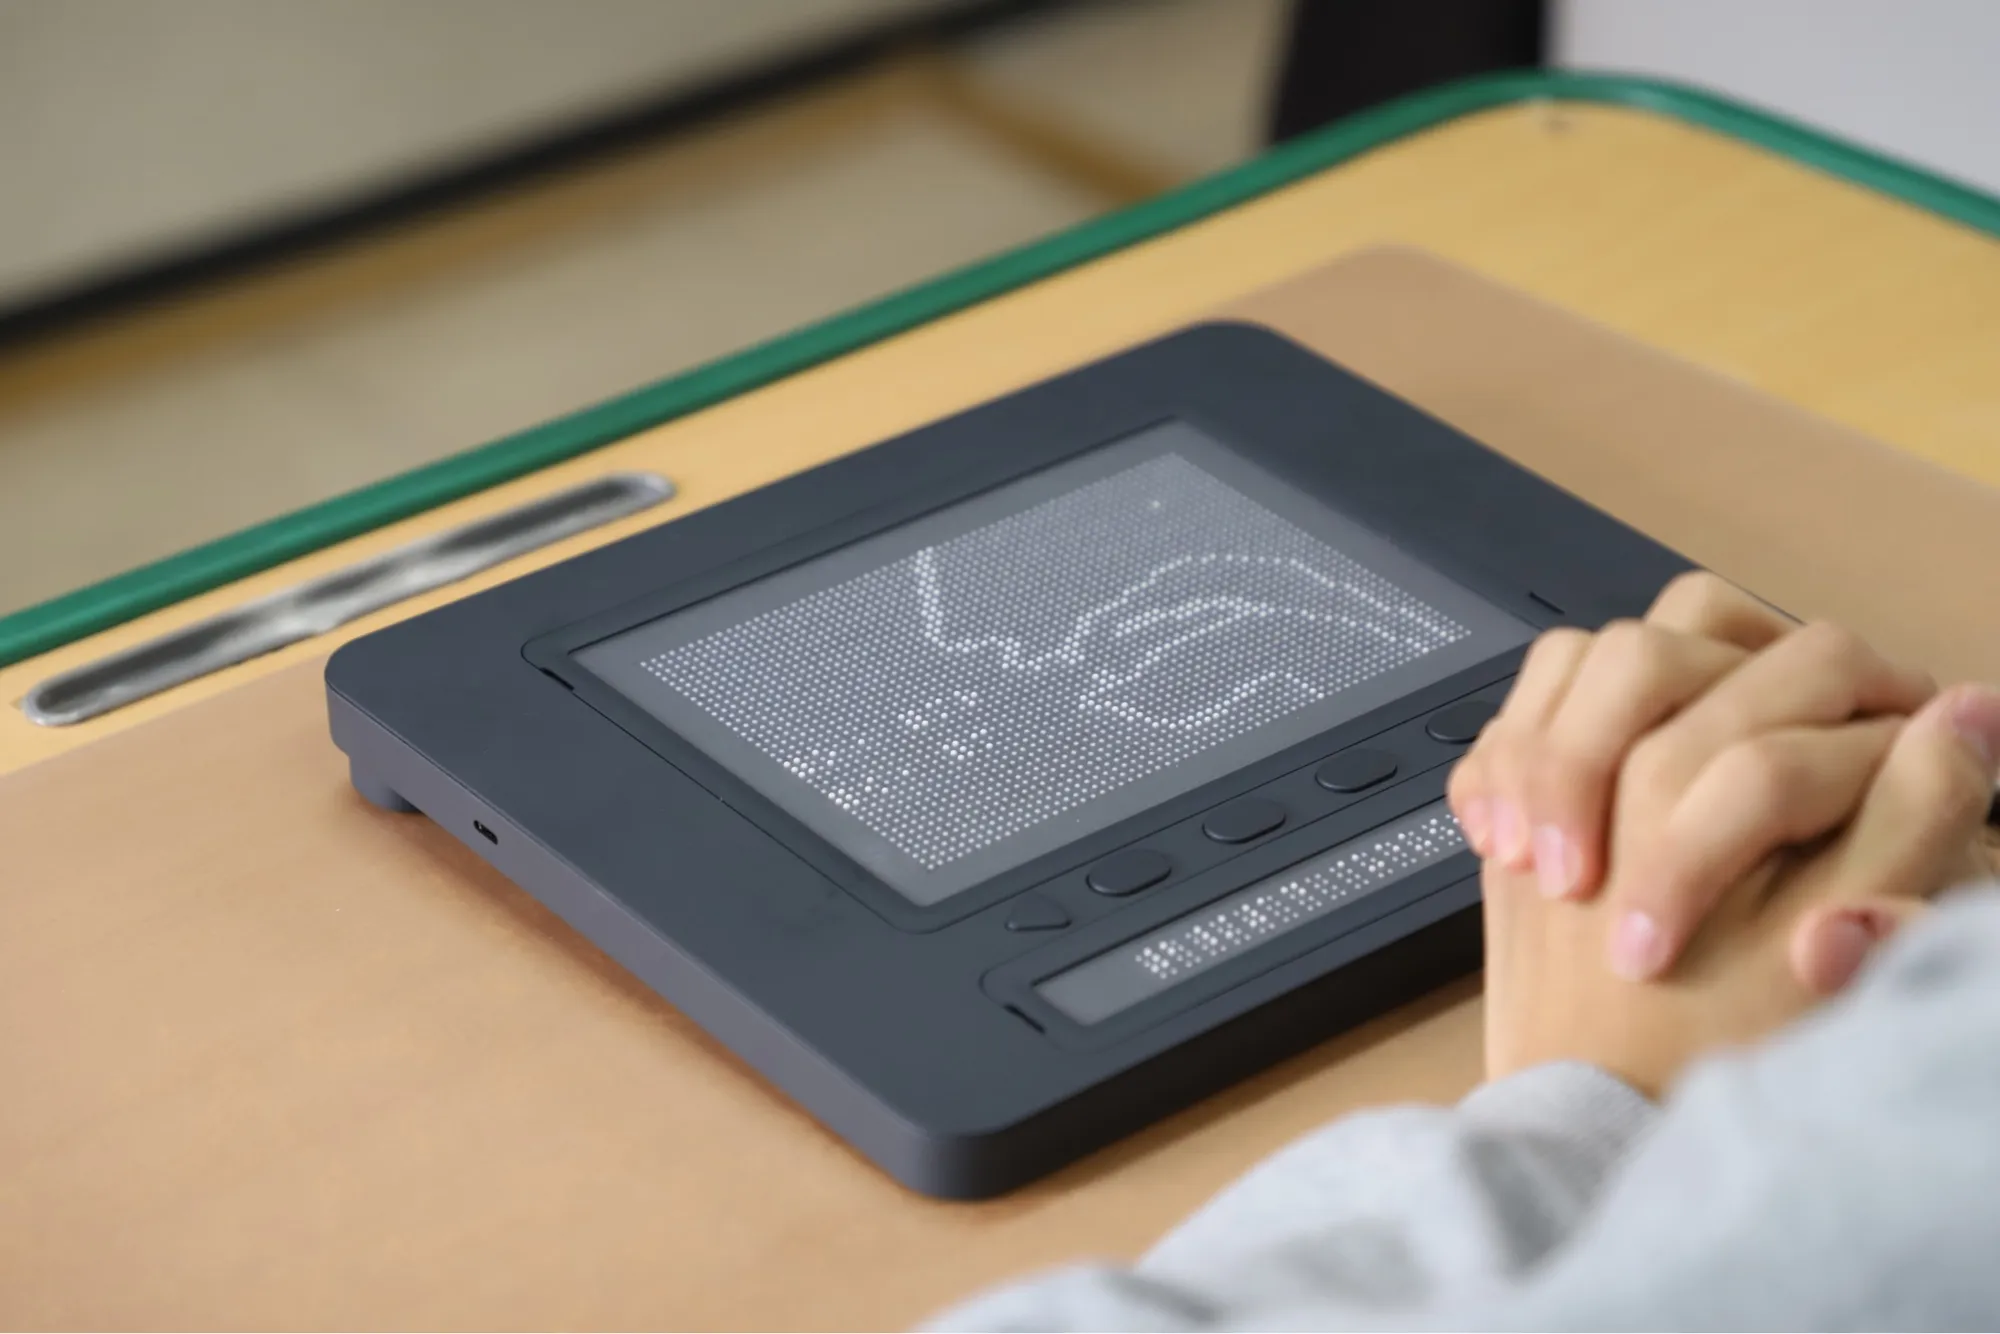
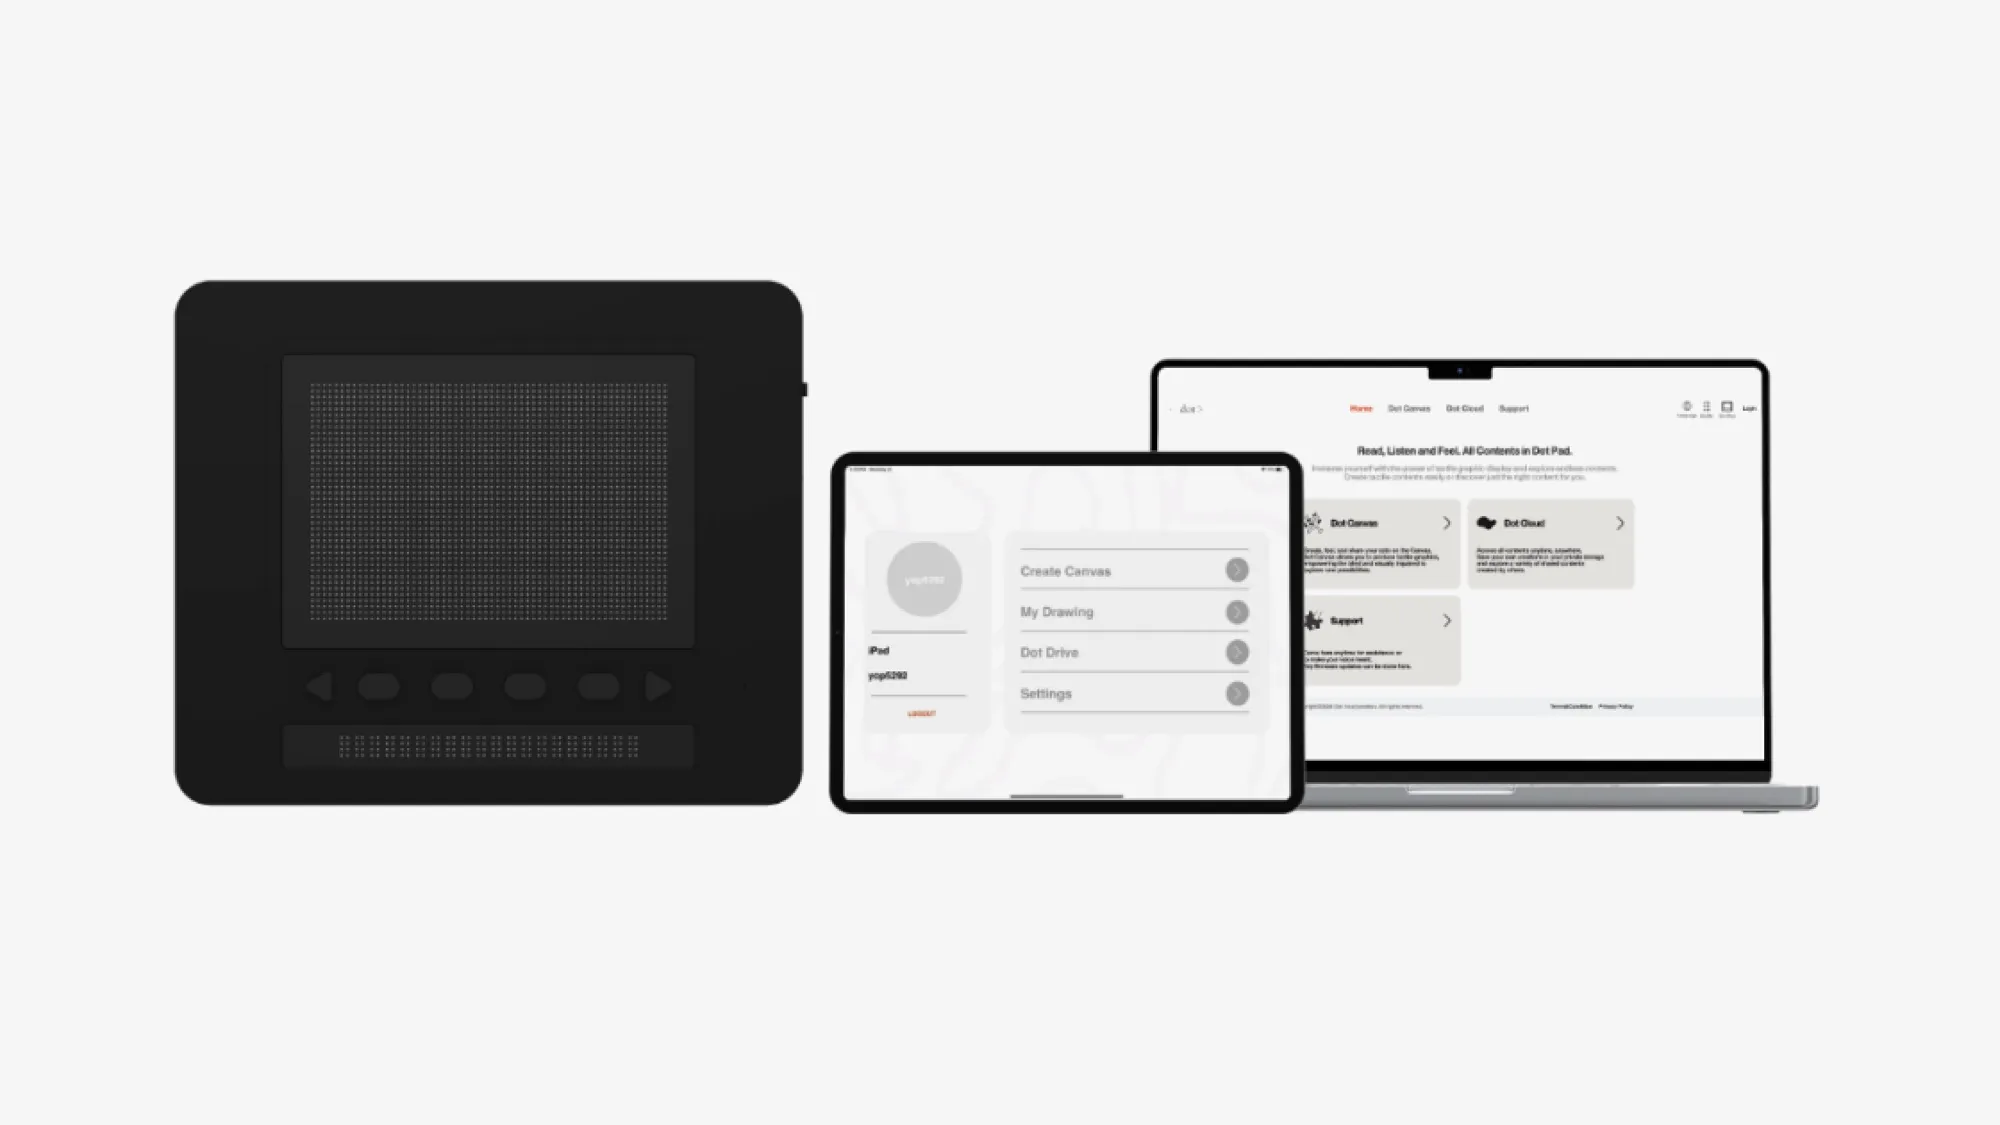
I took on the UX of Dot Canvas, an authoring tool that works with Dot Pad. Dot Canvas is a web and mobile app platform, designed so that non-specialists can create and share tactile graphics.
On the web platform you can create tactile graphics and store and share them in the cloud. The mobile app uses iPad touch and the Apple Pencil. It supports VoiceOver and live drawing, so visually impaired users can create tactile graphics themselves.
With these features, Dot Canvas aimed to lower the barrier to making tactile materials and to build a sustainable environment for tactile education.
SOLUTION
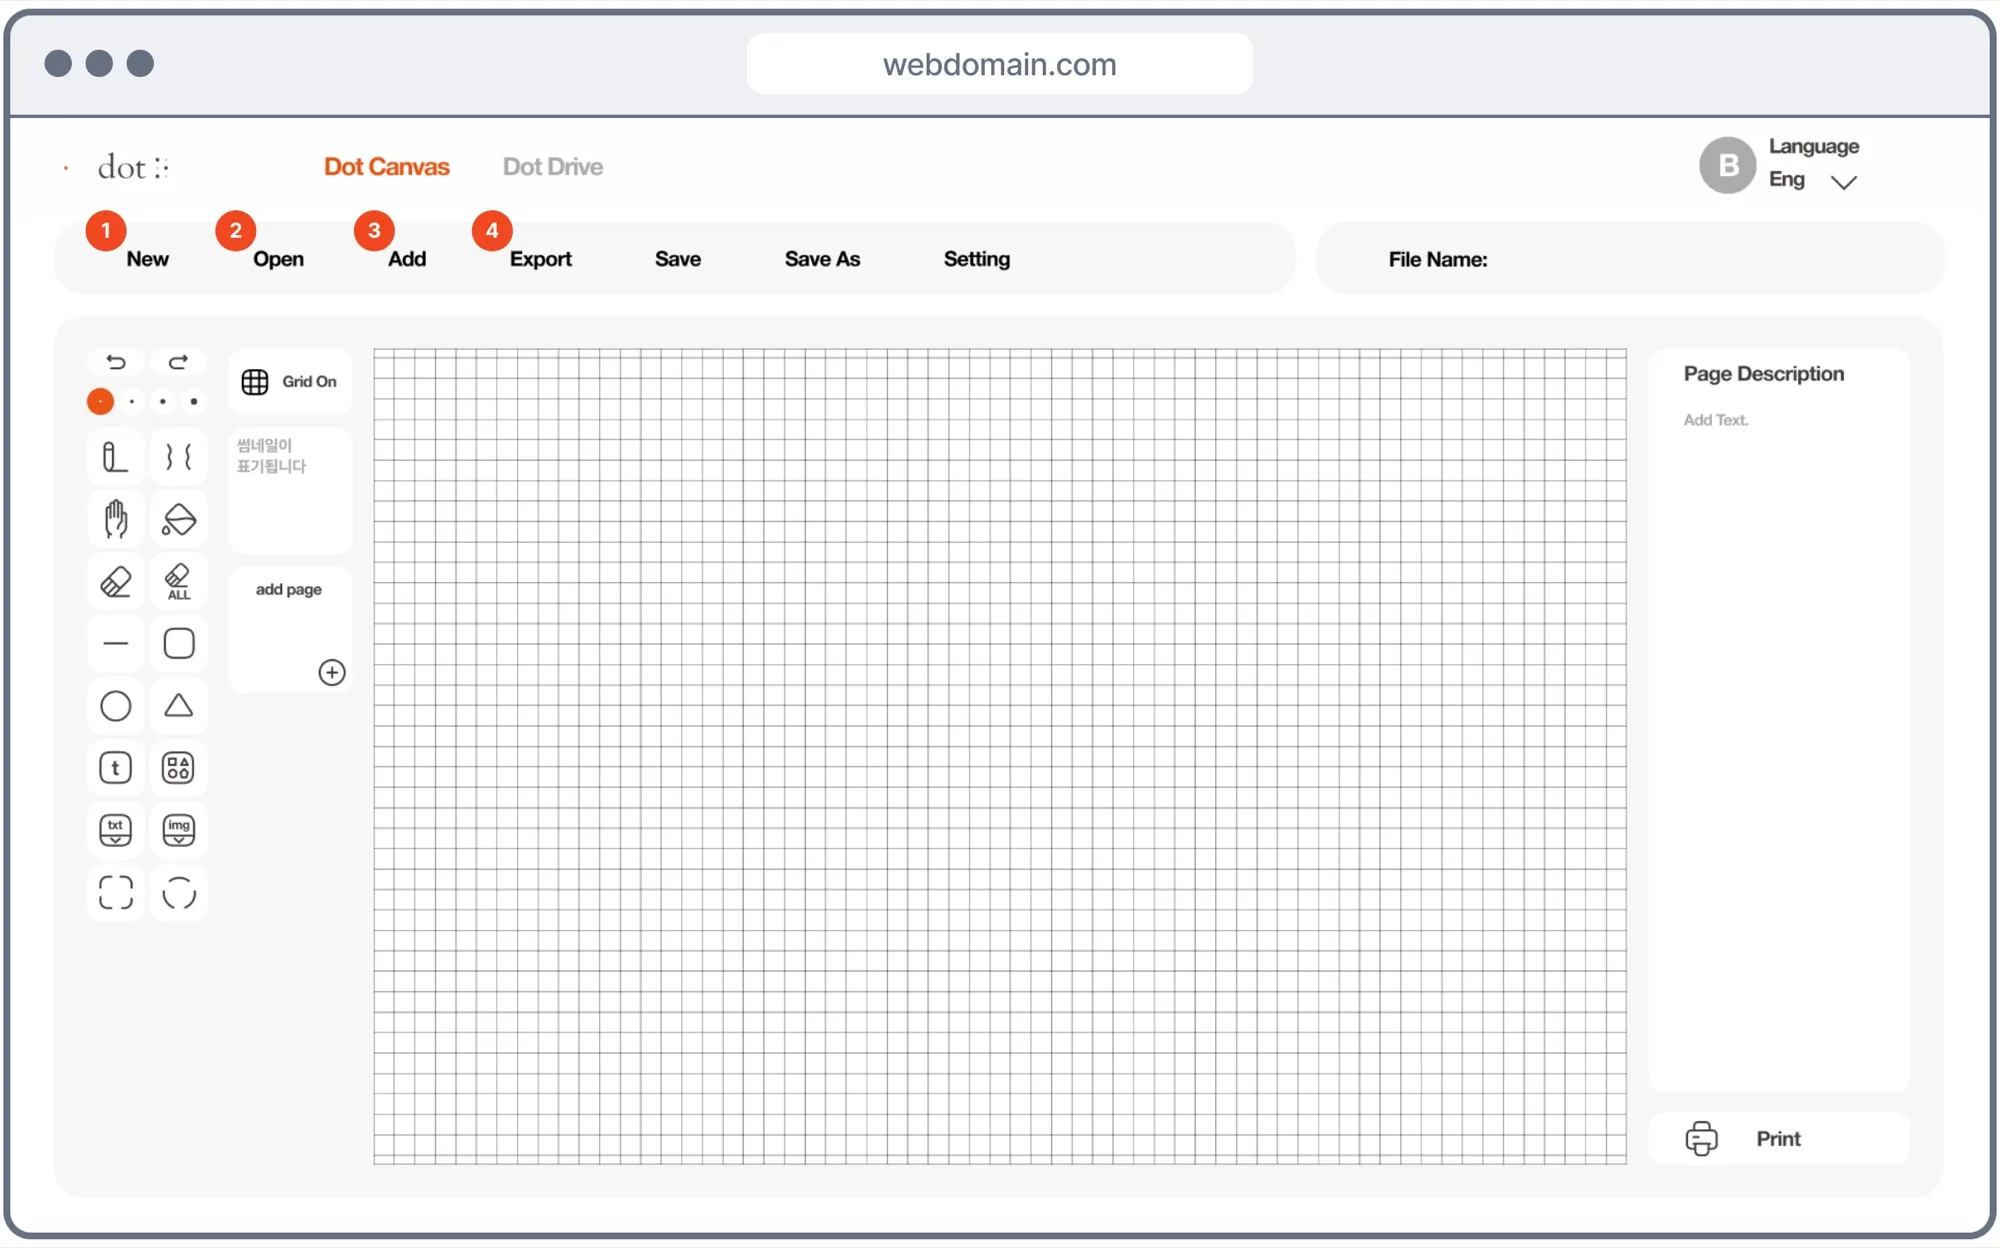
Web
A web-based tool for making tactile graphics: A web-optimized tool that lets non-specialists make tactile graphics. Along with editing features, it offers authoring options such as PDF and image import.
Cloud storage and sharing: Tactile graphics are stored in Dot Cloud and available anytime, anywhere, and the shared drive lets people exchange what they have made.
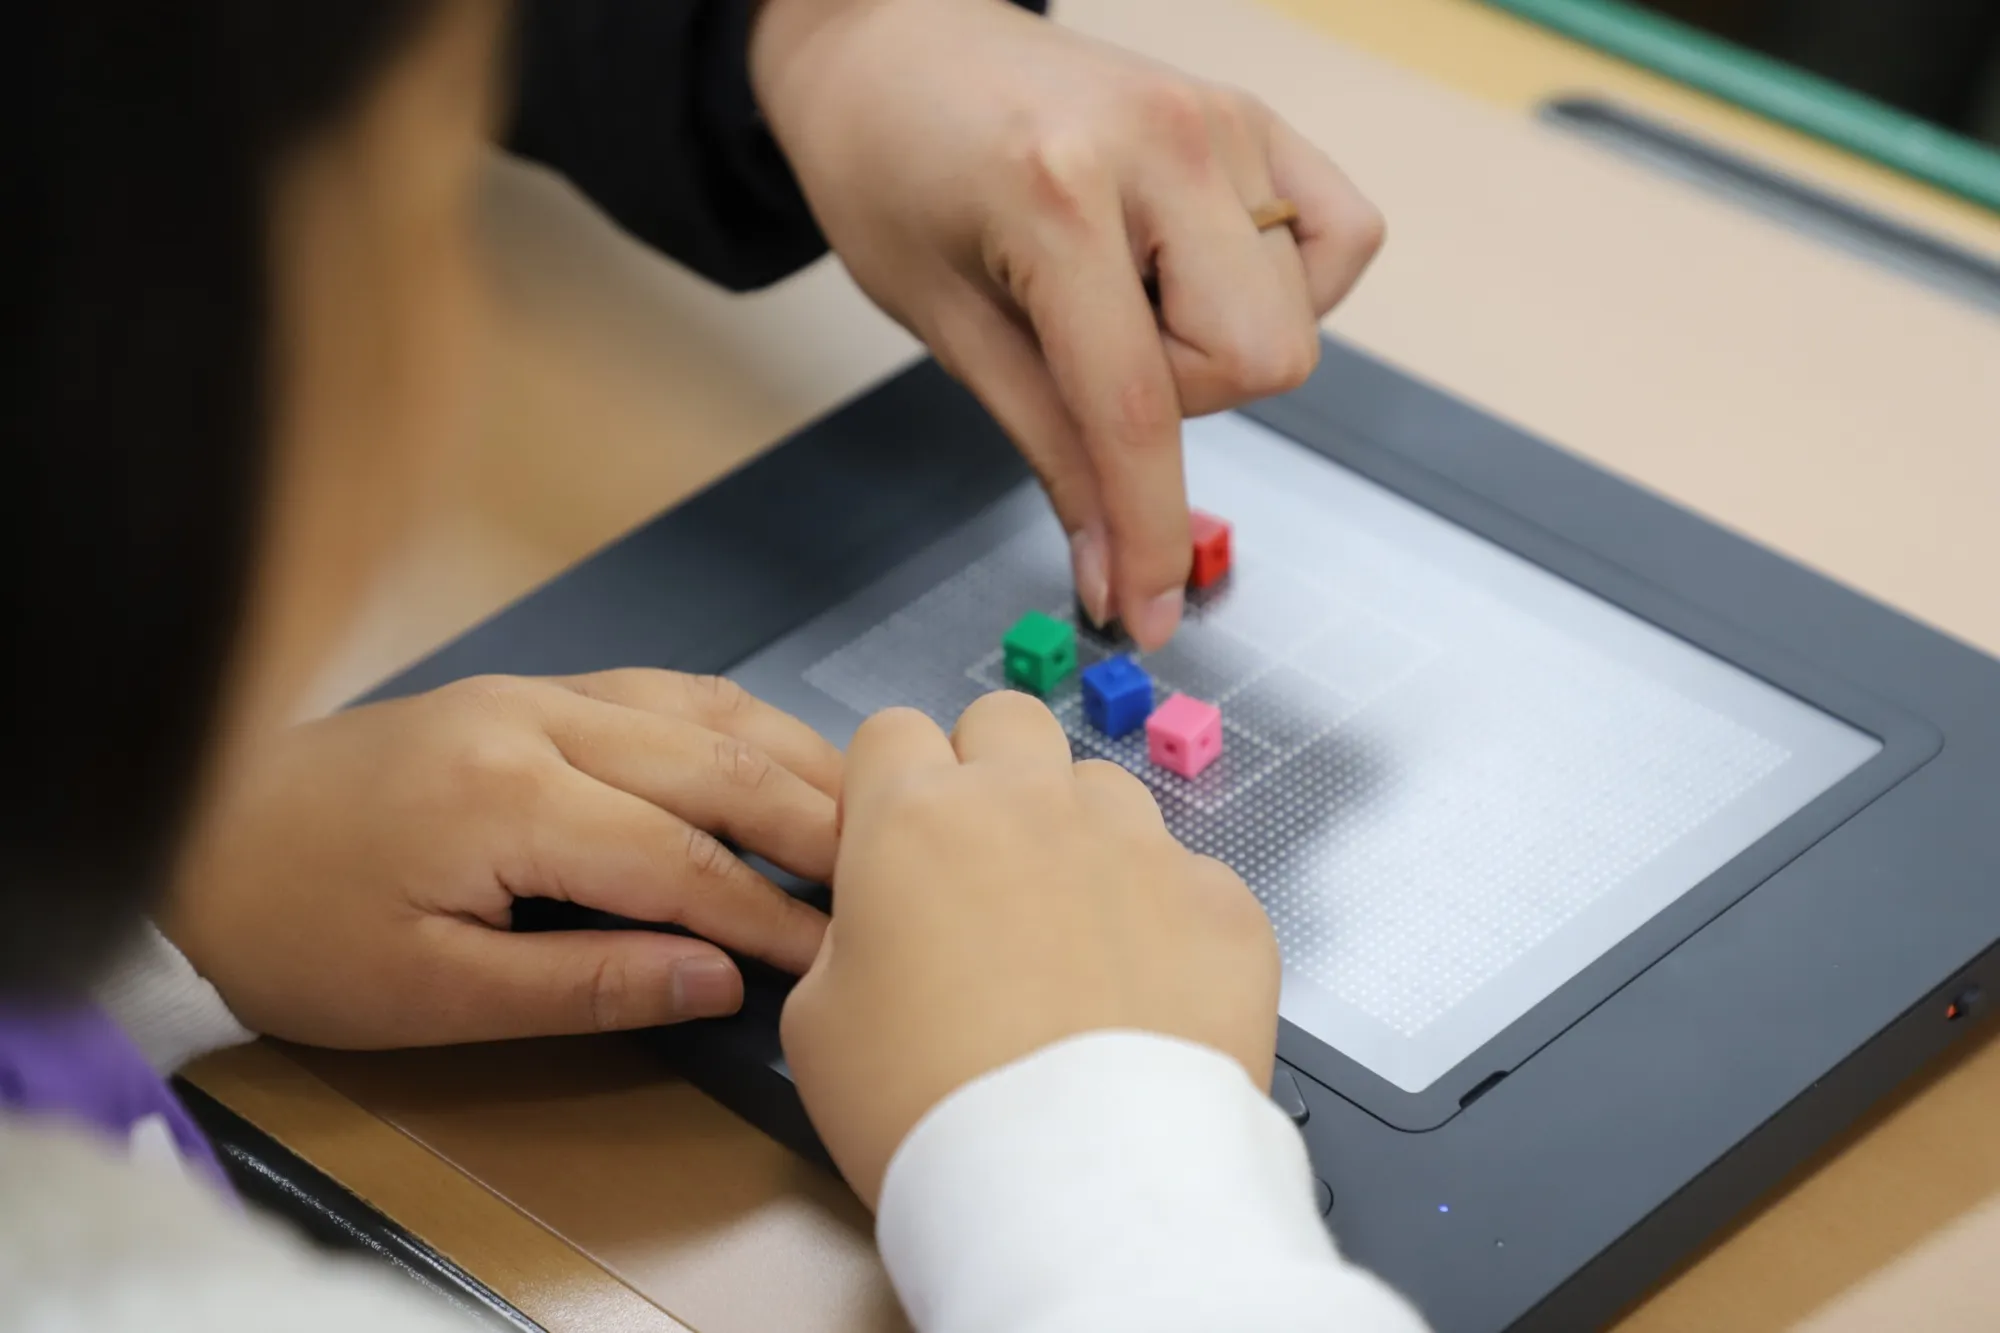
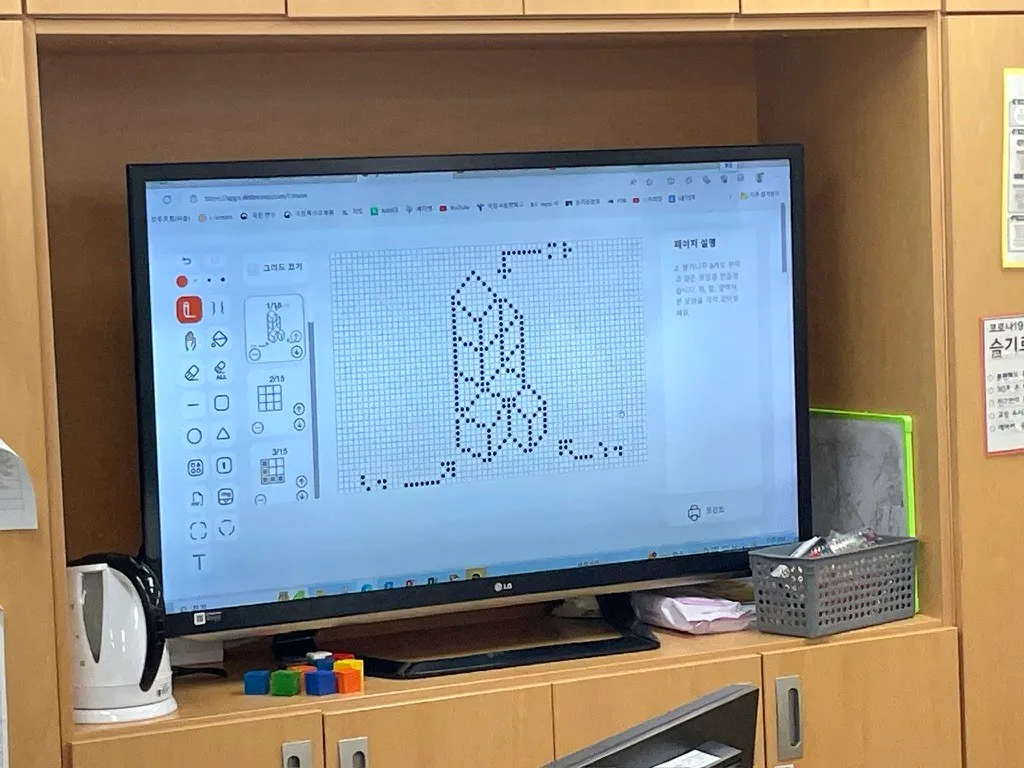
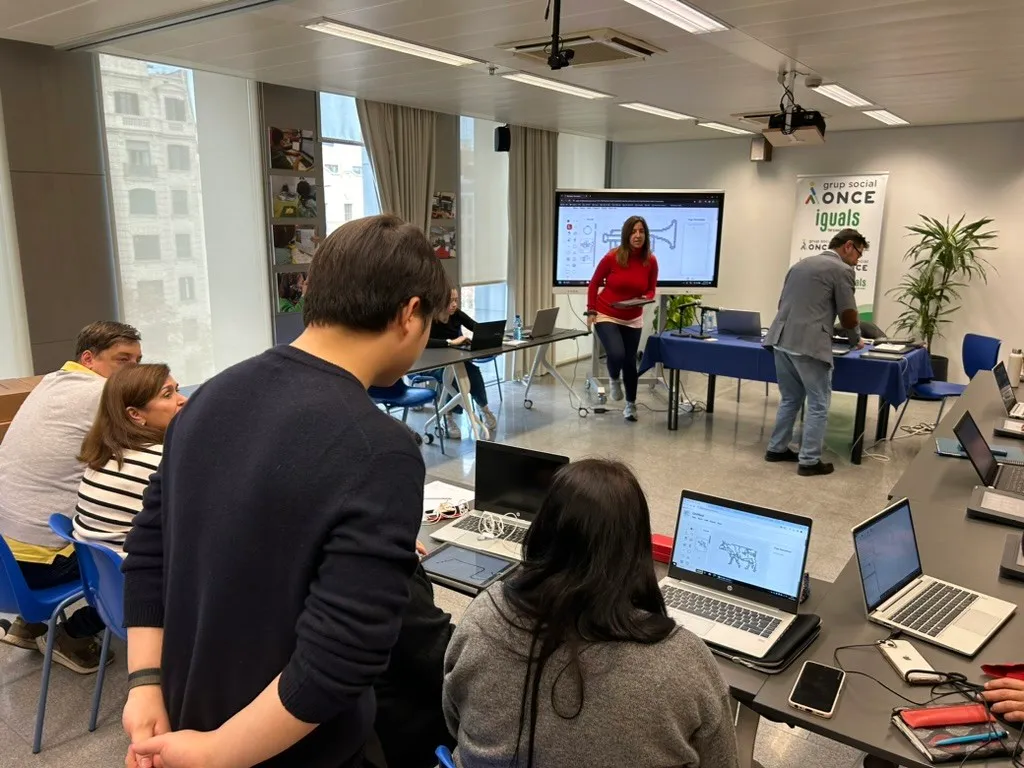
Real-time output to multiple Dot Pads: The same content can go out to up to 10 Dot Pads at once, so several users can touch a pre-made tactile graphic together and talk about it.
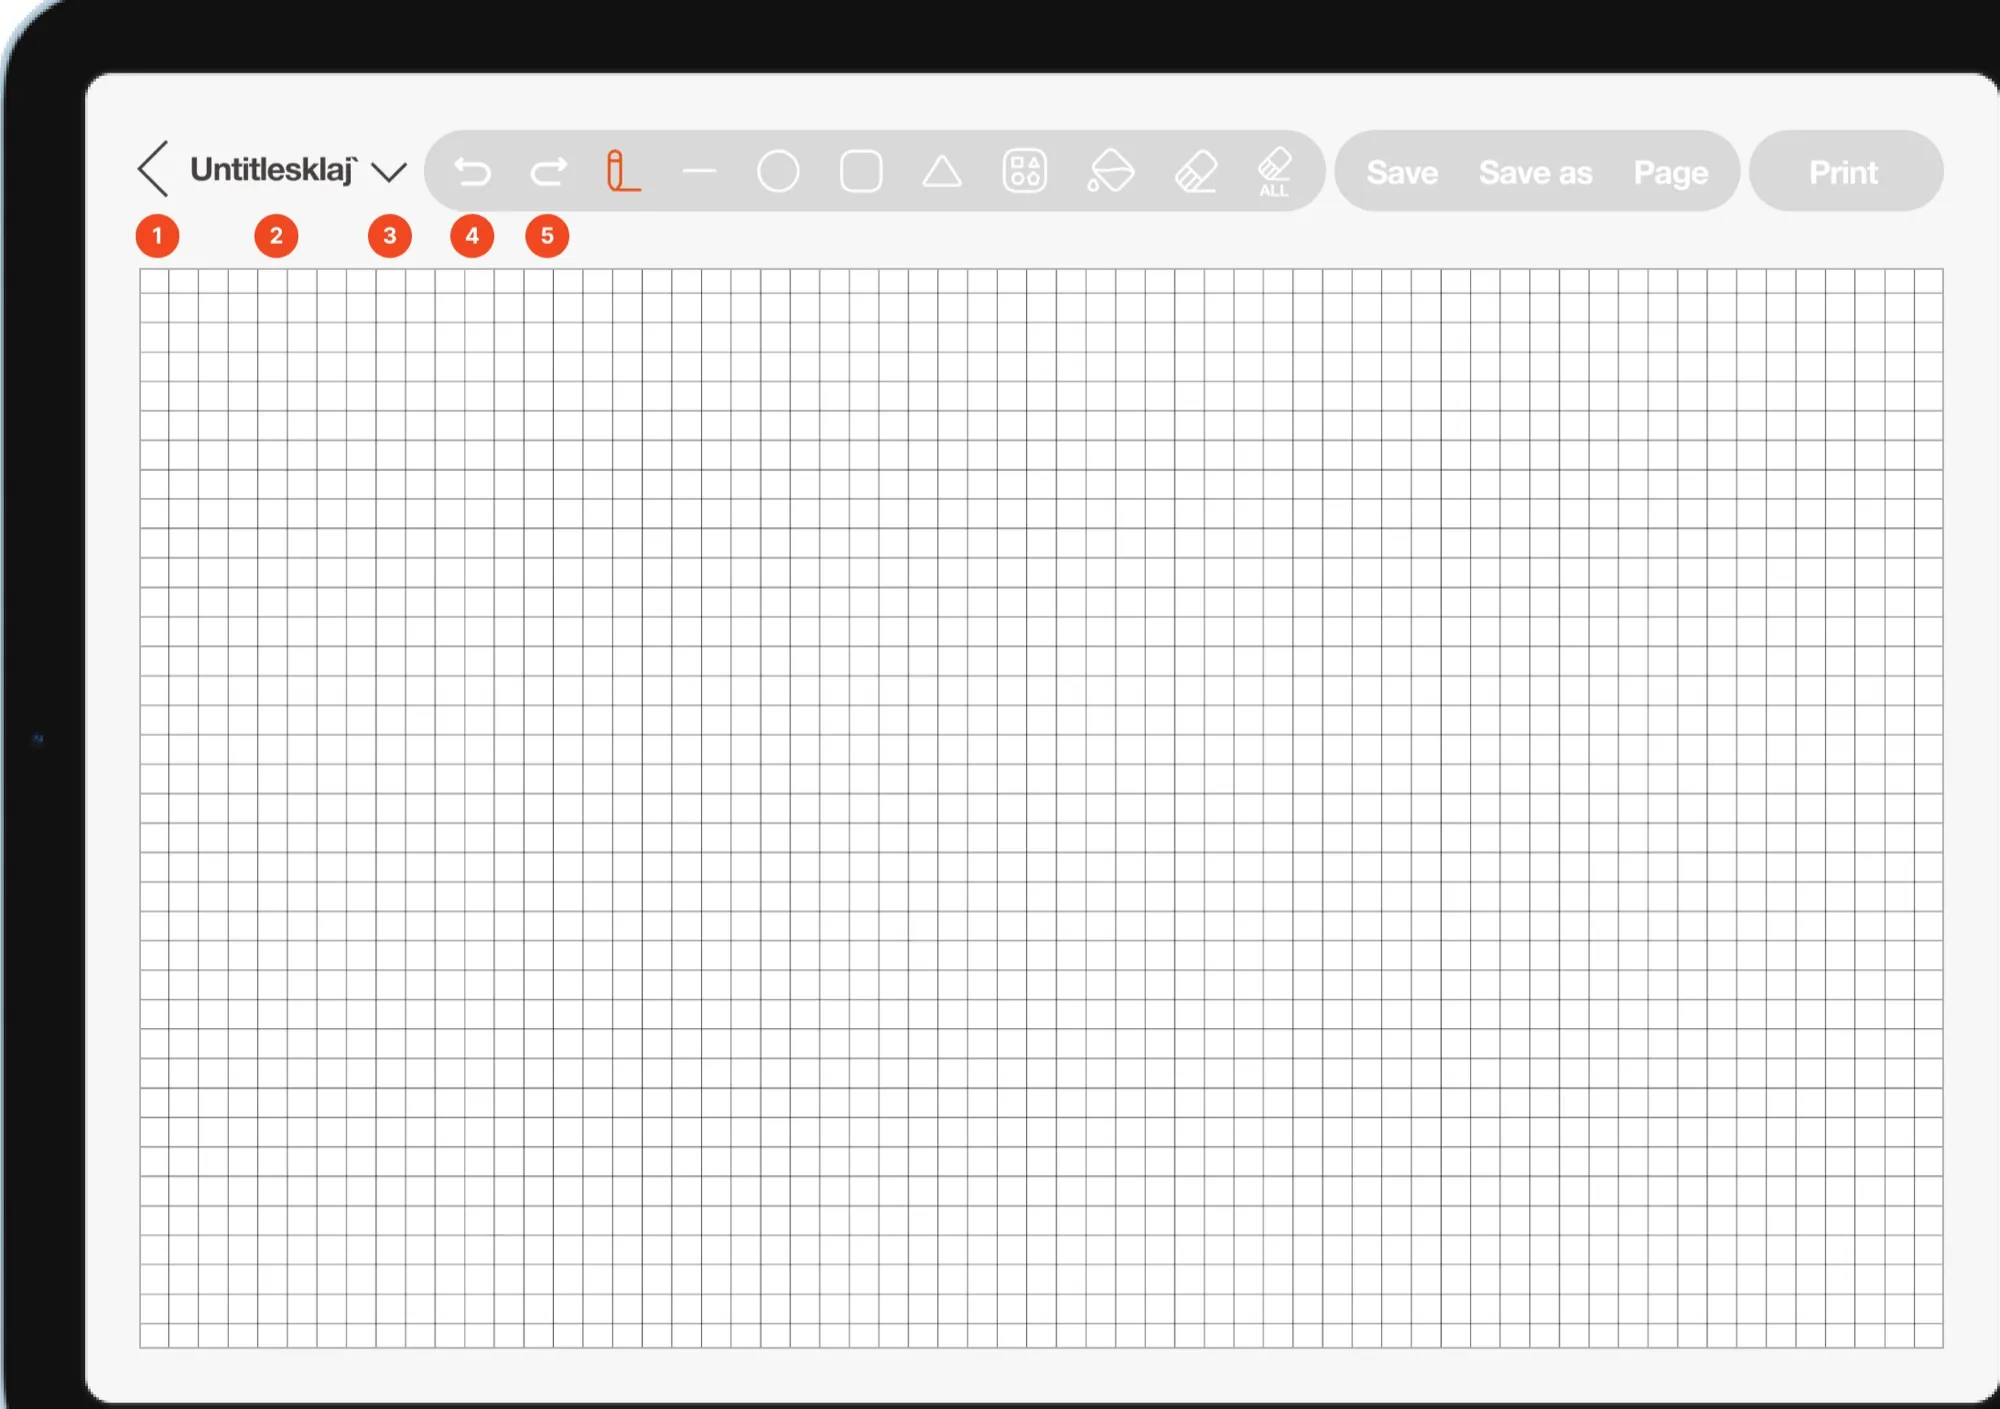
App
Making with touch and the Apple Pencil: A tactile-graphics tool optimized for iPad. Graphics are drawn with touch and the Apple Pencil, and the files are shared with the web through Dot Cloud.
Accessibility features for visually impaired users: It supports Apple’s VoiceOver and live drawing, so visually impaired people can make tactile graphics themselves and feel what they have drawn.
IMPLEMENTATION
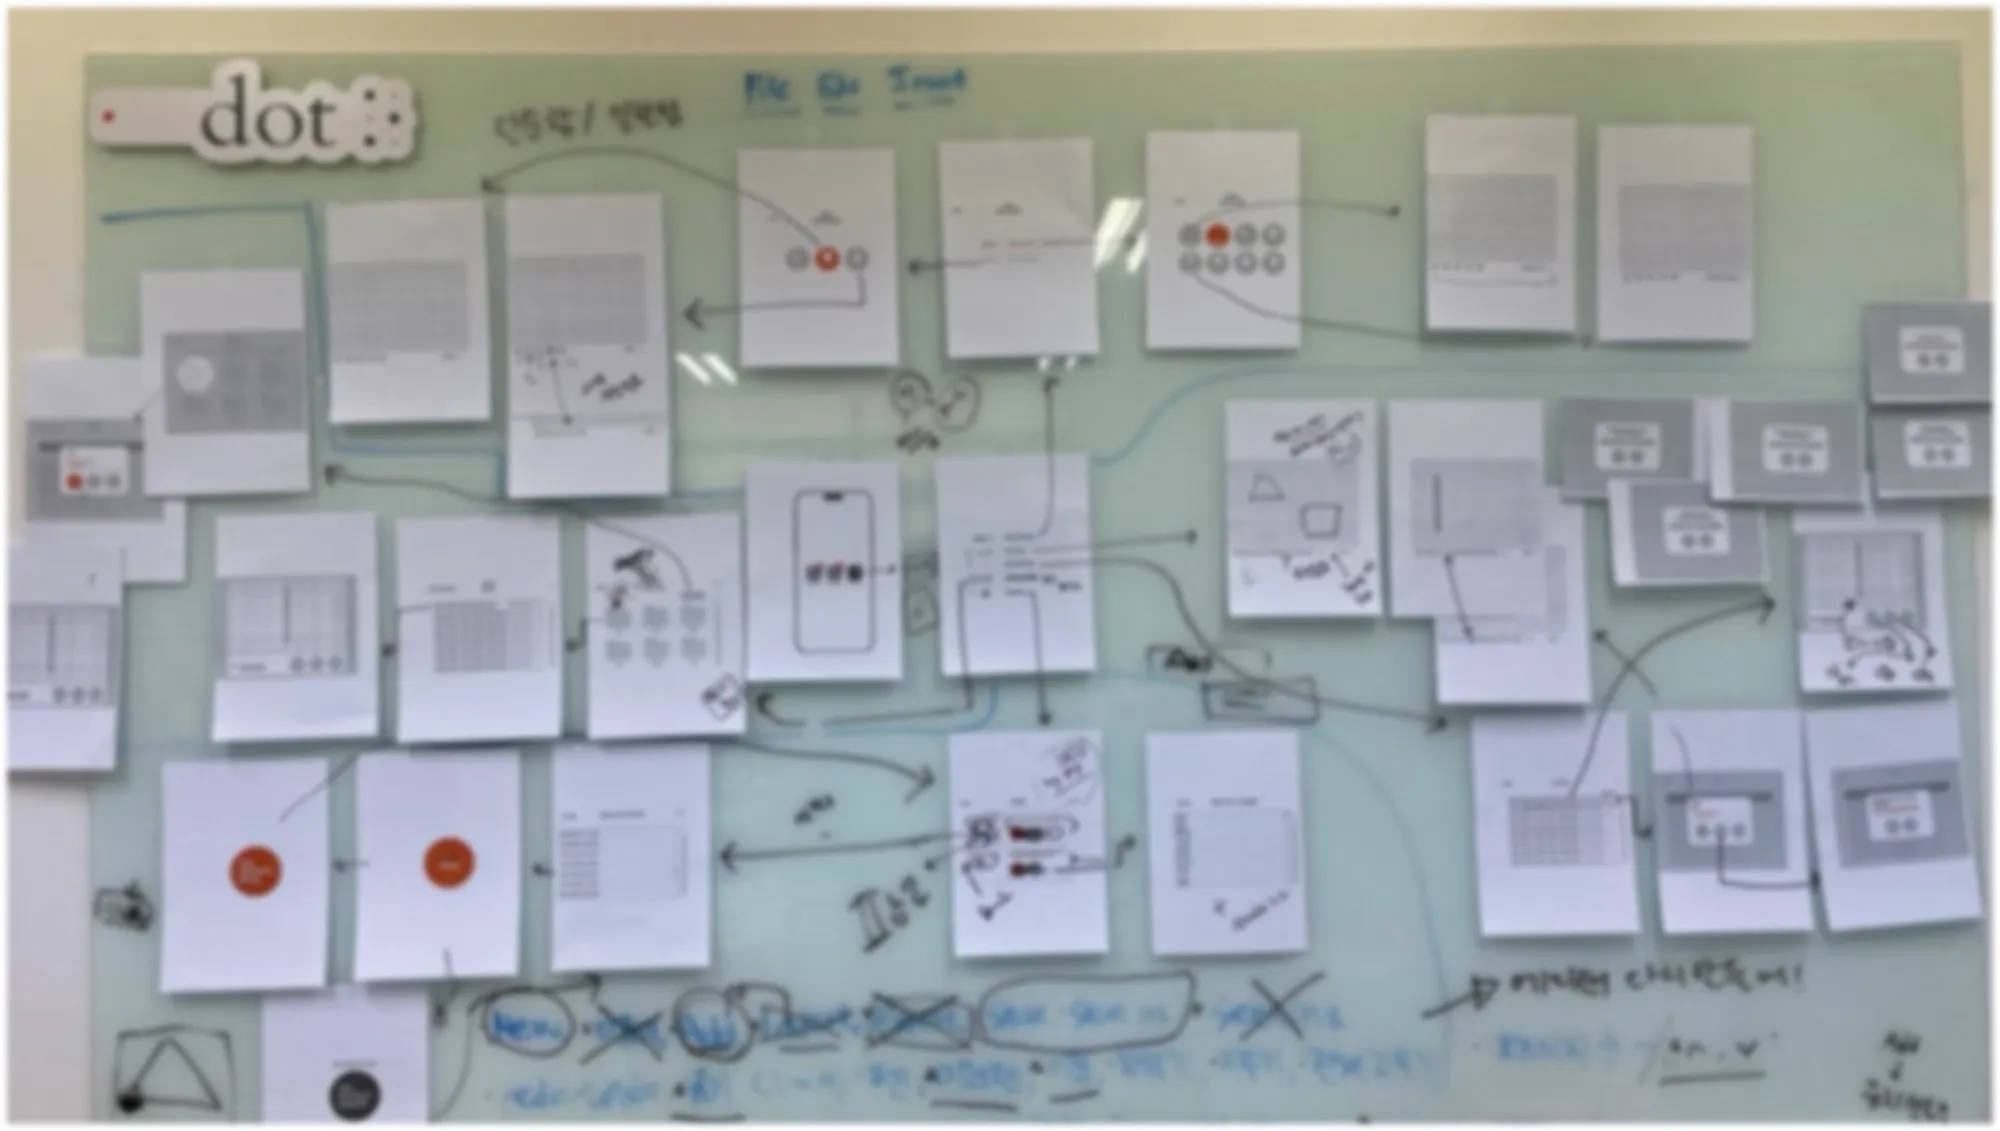
Screen design and GUI in Figma: Based on the user research, I did the screen design and GUI for Dot Canvas Web and App. I organized the UI structure and placed the functions to arrive at an interface that teachers and visually impaired students use together.
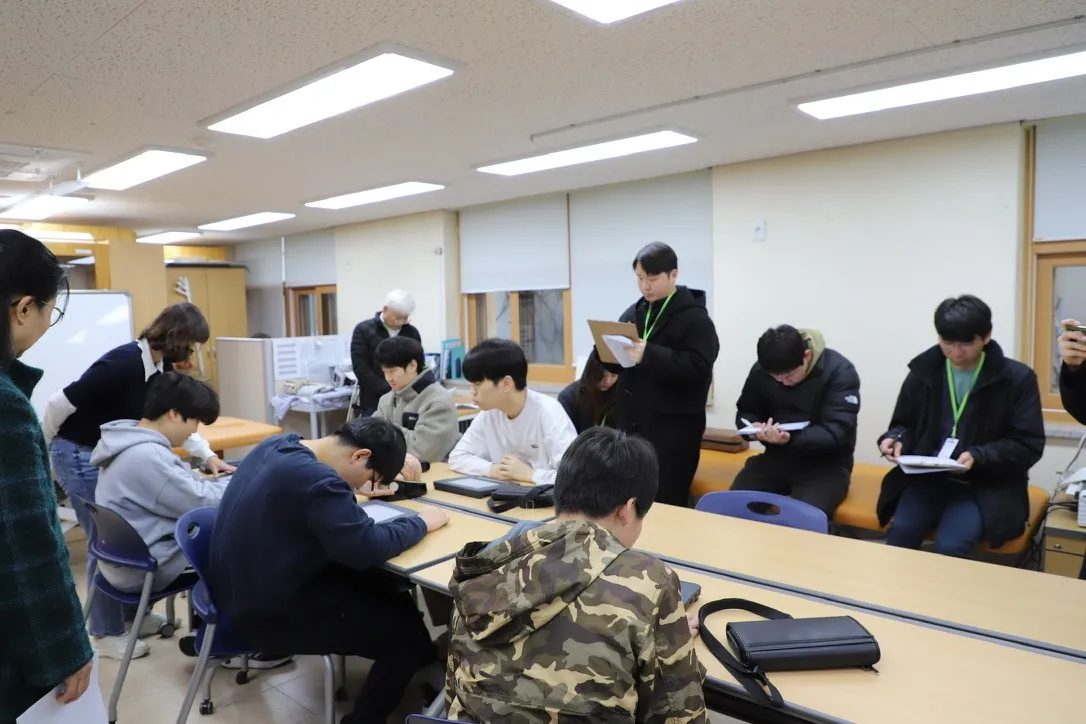
User research through a mix of methods: In Korea we ran field studies with special-education teachers and visually impaired students; for users abroad we used surveys and diary studies to look into the usage environment and its pain points. The data became the evidence for identifying problems in the first version of Canvas and setting the direction for improvements.
Developer collaboration and documentation: I documented screen specs and functional specifications and tracked project issues in JIRA. Working with the development team, we reflected technical changes and kept to the schedule for improvements and release.
IMPACT
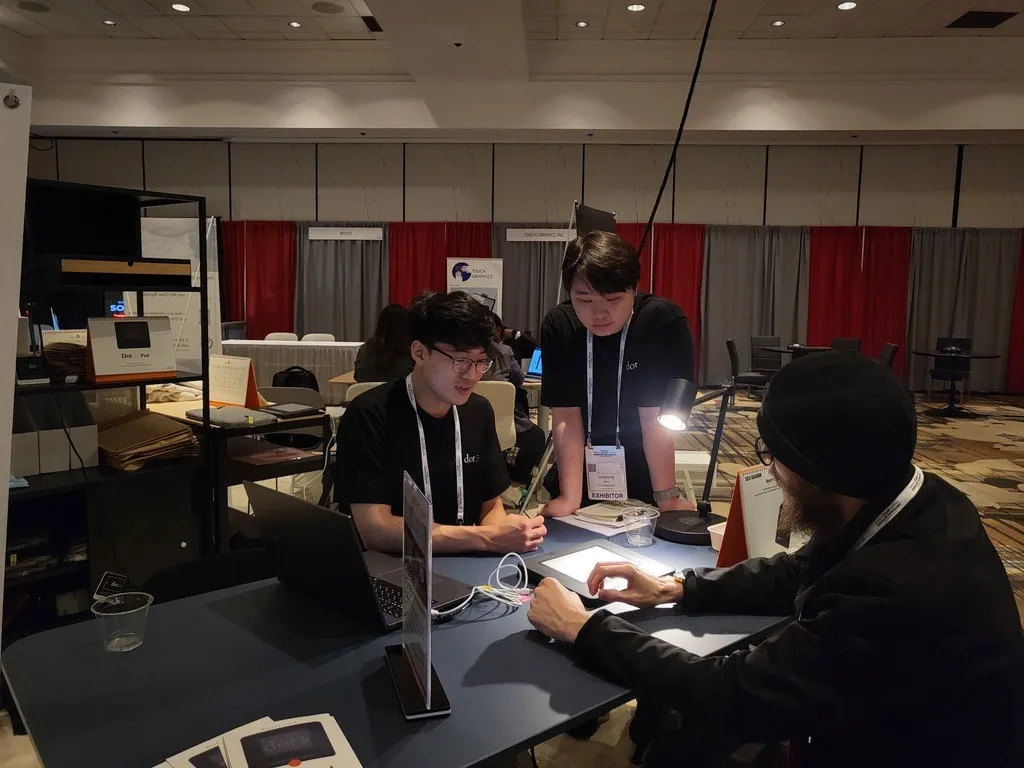
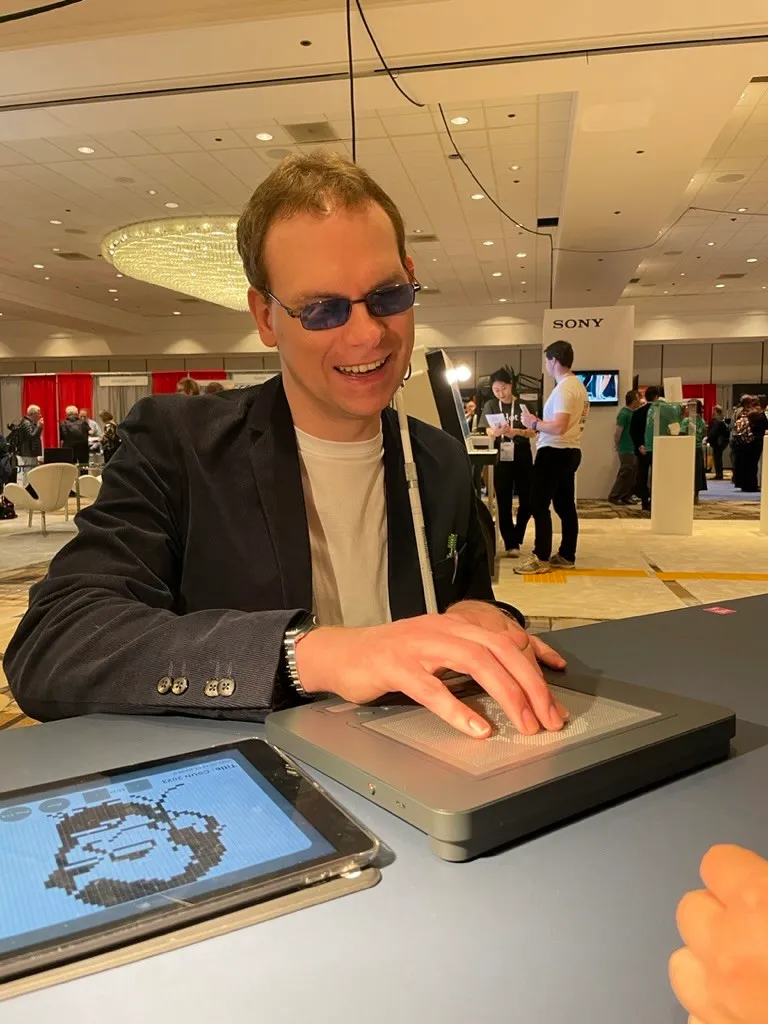
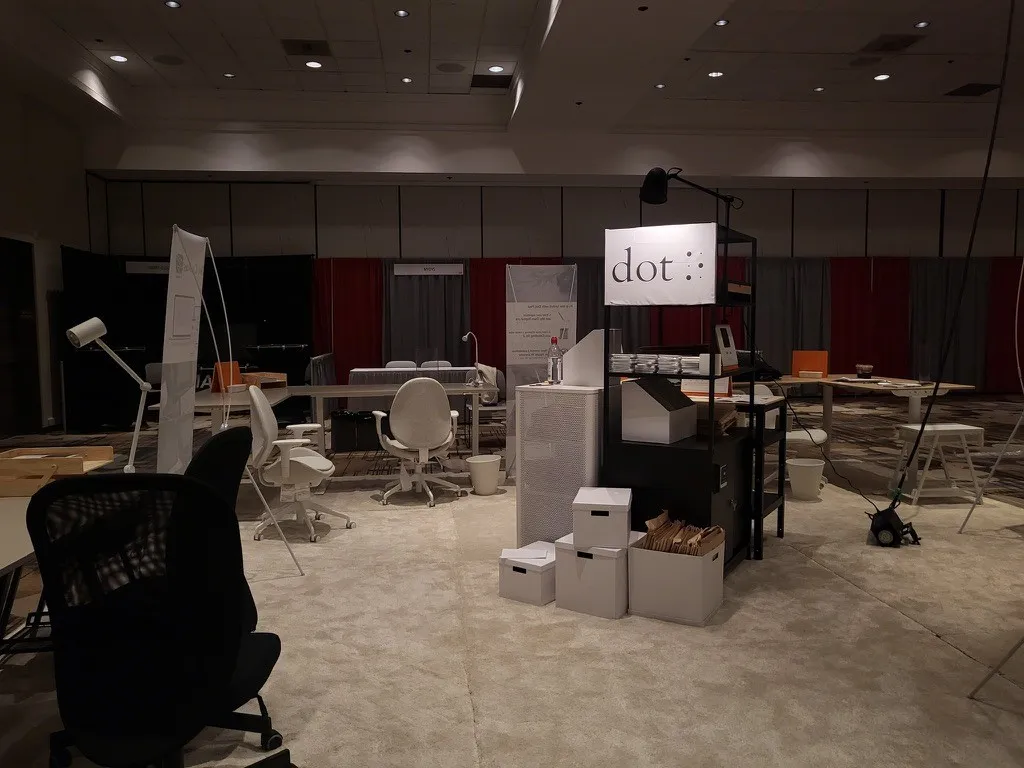
Dot Canvas won the CES 2024 Innovation Award and was shown at CSUN 2024.
REFLECTION
Weighing fast execution against long-term quality
Dot Canvas had to ship demo versions of both the web and the app in a short window. The team had little relevant experience, and we had three months to produce something usable, so we prototyped quickly with the team and took an execution-first approach. Along the way I handled not only UX design but practical work like collaborating with developers and managing the schedule.
The limits of moving fast were just as clear. We hit the short-term goal, but the design had not accounted for scale, so maintenance later required a lot of rework, and parts of it were rough. Hearing feedback directly in user studies showed me how much the balance between speed and quality matters in UX design.